
Cell type processing
Deconvolution analysis reduces the dimensionality and heterogeneity
of the deconvolution results. It uses the cell type processing algorithm
described in the paper Hurtado
et al., 2025. It returns the cell type subgroups composition and the
reduced deconvolution matrix, saved in the Results/
directory.
Within each cell type, features (method-signature estimates) are
grouped by complete-linkage hierarchical clustering of their
correlations: features form a subgroup only if every
pair of them correlates at least corr
(non-significant correlations count as 0). Each subgroup is summarised
by the median of its members.
Key parameters:
-
deconvolution: Matrix of raw deconvolution results
(output of
compute.deconvolution()) - corr: Minimum correlation threshold to group features
-
return: Whether to return results and save output
files to the
Results/directory - batch: Optional factor vector of cohort/batch labels (see section below on batch correction)
deconv_bulk = multideconv::deconv_bulk
deconv_subgroups = compute.deconvolution.analysis(deconvolution = deconv_bulk,
                                                  corr = 0.7,
                                                  file_name = "Tutorial",
                                                  return = TRUE)
The result is a named list with six elements:
names(deconv_subgroups)
#> [1] "Deconvolution matrix"
#> [2] "Deconvolution subgroups per cell types"
#> [3] "Deconvolution subgroups composition"
#> [4] "Discarded features with high number of zeros"
#> [5] "Discarded features with low variance"
#> [6] "Discarded cell types"
Access the reduced deconvolution matrix (samples × subgroups):
head(deconv_subgroups[["Deconvolution matrix"]][, sample(ncol(deconv_subgroups[["Deconvolution matrix"]]), 5)])
#>                 DeconRNASeq_CBSX.Melanoma.scRNAseq_Endothelial
#> SAM7f0d9cc7f001                                      0.1247419
#> SAM4305ab968b90                                      0.1847182
#> SAMcf018fee2acd                                      0.1672997
#> SAMcc4675f394a1                                      0.2070710
#> SAM49f9b2e57aa5                                      0.1639431
#> SAM2e7aa8fa0ab3                                      0.1168617
#>                 DeconRNASeq_LM22_T.cells.helper CBSX_BPRNACanProMet_Neutrophils
#> SAM7f0d9cc7f001                      0.00000000                    0.0034759832
#> SAM4305ab968b90                      0.08389950                    0.0000000000
#> SAMcf018fee2acd                      0.00000000                    0.0029090514
#> SAMcc4675f394a1                      0.00000000                    0.0000000000
#> SAM49f9b2e57aa5                      0.06256773                    0.0000000000
#> SAM2e7aa8fa0ab3                      0.01772861                    0.0004672195
#>                 DeconRNASeq_CBSX.Melanoma.scRNAseq_CD4.cells
#> SAM7f0d9cc7f001                                   0.07161836
#> SAM4305ab968b90                                   0.07890048
#> SAMcf018fee2acd                                   0.07567607
#> SAMcc4675f394a1                                   0.07173726
#> SAM49f9b2e57aa5                                   0.07369131
#> SAM2e7aa8fa0ab3                                   0.05237417
#>                 CD4.cells_Subgroup.2
#> SAM7f0d9cc7f001           0.18051700
#> SAM4305ab968b90           0.00000000
#> SAMcf018fee2acd           0.19511491
#> SAMcc4675f394a1           0.06190600
#> SAM49f9b2e57aa5           0.15741680
#> SAM2e7aa8fa0ab3           0.07050168
Inspect subgroup composition (which methods/signatures were merged into each subgroup):
deconv_subgroups[["Deconvolution subgroups composition"]]$B.cells
#> $B.cells_Subgroup.1
#> [1] "CBSX_BPRNACan_B.cells"            "CBSX_BPRNACan3DProMet_B.cells"
#> [3] "CBSX_BPRNACanProMet_B.cells"      "DWLS_BPRNACan_B.cells"
#> [5] "DWLS_BPRNACan3DProMet_B.cells"    "DWLS_BPRNACanProMet_B.cells"
#> [7] "Epidish_BPRNACan_B.cells"         "Epidish_BPRNACan3DProMet_B.cells"
#> [9] "Epidish_BPRNACanProMet_B.cells"
#>
#> $B.cells_Subgroup.2
#> [1] "CBSX_CBSX.HNSCC.scRNAseq_B.cells"
#> [2] "DeconRNASeq_CBSX.HNSCC.scRNAseq_B.cells"
#> [3] "DWLS_CBSX.HNSCC.scRNAseq_B.cells"
#> [4] "Epidish_CBSX.HNSCC.scRNAseq_B.cells"
#>
#> $B.cells_Subgroup.3
#> [1] "CBSX_CBSX.Melanoma.scRNAseq_B.cells"
#> [2] "DWLS_CBSX.Melanoma.scRNAseq_B.cells"
#> [3] "Epidish_CBSX.Melanoma.scRNAseq_B.cells"
#>
#> $B.cells_Subgroup.4
#> [1] "DeconRNASeq_BPRNACan_B.cells"
#> [2] "DeconRNASeq_BPRNACan3DProMet_B.cells"
#> [3] "DeconRNASeq_BPRNACanProMet_B.cells"
#>
#> $B.cells_Subgroup.5
#> [1] "DeconRNASeq_CCLE.TIL10_B.cells" "DeconRNASeq_TIL10_B.cells"
#>
#> $B.cells_Subgroup.6
#> [1] "DWLS_CBSX.NSCLC.PBMCs.scRNAseq_B.cells"
#> [2] "Epidish_CBSX.NSCLC.PBMCs.scRNAseq_B.cells"
deconv_subgroups[["Deconvolution subgroups composition"]]$Macrophages.M2
#> $Macrophages.M2_Subgroup.1
#> [1] "CBSX_BPRNACan_Macrophages.M2"
#> [2] "CBSX_BPRNACanProMet_Macrophages.M2"
#> [3] "DWLS_BPRNACan_Macrophages.M2"
#> [4] "DWLS_BPRNACan3DProMet_Macrophages.M2"
#> [5] "DWLS_BPRNACanProMet_Macrophages.M2"
#> [6] "Epidish_BPRNACan_Macrophages.M2"
#> [7] "Epidish_BPRNACan3DProMet_Macrophages.M2"
#> [8] "Epidish_BPRNACanProMet_Macrophages.M2"
#>
#> $Macrophages.M2_Subgroup.2
#> [1] "CBSX_LM22_Macrophages.M2"    "DWLS_LM22_Macrophages.M2"
#> [3] "Epidish_LM22_Macrophages.M2"
#>
#> $Macrophages.M2_Subgroup.3
#> [1] "DeconRNASeq_BPRNACan_Macrophages.M2"
#> [2] "DeconRNASeq_BPRNACan3DProMet_Macrophages.M2"
#> [3] "DeconRNASeq_BPRNACanProMet_Macrophages.M2"
#>
#> $Macrophages.M2_Subgroup.4
#> [1] "DeconRNASeq_CCLE.TIL10_Macrophages.M2"
#> [2] "DeconRNASeq_TIL10_Macrophages.M2"
#>
#> $Macrophages.M2_Subgroup.5
#> [1] "DWLS_CCLE.TIL10_Macrophages.M2"    "Epidish_CCLE.TIL10_Macrophages.M2"
#>
#> $Macrophages.M2_Subgroup.6
#> [1] "DWLS_TIL10_Macrophages.M2"    "Epidish_TIL10_Macrophages.M2"
deconv_subgroups[["Deconvolution subgroups composition"]]$Dendritic.cells
#> $Dendritic.cells_Subgroup.1
#> [1] "CBSX_CBSX.HNSCC.scRNAseq_Dendritic.cells"
#> [2] "DWLS_CBSX.HNSCC.scRNAseq_Dendritic.cells"
#> [3] "Epidish_CBSX.HNSCC.scRNAseq_Dendritic.cells"
If your deconvolution matrix contains non-standard cell types (see
README), specify them using cells_extra to ensure proper
subgrouping. If not specified, they will be discarded automatically.
deconv_subgroups = compute.deconvolution.analysis(deconvolution = deconv_pseudo,
                                                  corr = 0.7,
                                                  return = TRUE,
                                                  cells_extra = c("Mural.cells", "Myeloid.cells"),
                                                  file_name = "Tutorial")
Aggregating cell types into groups
Signatures do not describe cell types with the same level of detail:
one reports Macrophages.M1, Macrophages.M2 and
Monocytes, another one only Myeloid.cells. To
compare them at the same level, or to match a coarser ground truth
(e.g. H&E or flow cytometry), you can sum cell types into groups
with aggregate_cell_groups(). It is an optional step after
compute.deconvolution(), independent of the subgroup
analysis: it takes a deconvolution matrix and returns it with the group
features added.
cell_groups is a named list: each name is a group and
each element contains the cell types to sum, written as in
get_cell_type_nomenclature(). For every method-signature
combination, the function adds a new feature
<method>_<signature>_<group>:
- Cell types are summed only within the same method-signature combination, where the estimates are proportions of the same sample.
- The original features are kept.
- A combination that already estimates the group (e.g. a signature
with its own
Myeloid.cells) is left as it is. - A combination needs at least
min_types = 2cell types of the group, otherwise it is skipped (the group would be a copy of a single cell type).
The function prints which cell types were summed in each combination:
myeloid = list(Myeloid.cells = c("Macrophages.cells", "Macrophages.M0", "Macrophages.M1", "Macrophages.M2",
                                 "Monocytes", "Dendritic.cells", "Dendritic.activated.cells",
                                 "Dendritic.resting.cells"))

deconv_groups = aggregate_cell_groups(deconv_bulk, cell_groups = myeloid)
#>
#> Group 'Myeloid.cells'
#>   Quantiseq: Macrophages.M1 + Macrophages.M2 + Monocytes + Dendritic.cells
#>   DeconRNASeq_BPRNACan: Macrophages.M0 + Macrophages.M1 + Macrophages.M2 + Monocytes
#>   Epidish_BPRNACan: Macrophages.M0 + Macrophages.M1 + Macrophages.M2 + Monocytes
#>   DeconRNASeq_BPRNACan3DProMet: Macrophages.M0 + Macrophages.M1 + Macrophages.M2 + Monocytes
#>   Epidish_BPRNACan3DProMet: Macrophages.M0 + Macrophages.M1 + Macrophages.M2 + Monocytes
#>   DeconRNASeq_BPRNACanProMet: Macrophages.M0 + Macrophages.M1 + Macrophages.M2 + Monocytes
#>   Epidish_BPRNACanProMet: Macrophages.M0 + Macrophages.M1 + Macrophages.M2 + Monocytes
#>   DeconRNASeq_CBSX.HNSCC.scRNAseq: Macrophages.cells + Dendritic.cells
#>   Epidish_CBSX.HNSCC.scRNAseq: Macrophages.cells + Dendritic.cells
#>   DeconRNASeq_CBSX.Melanoma.scRNAseq: skipped (1 member: Macrophages.cells)
#>   Epidish_CBSX.Melanoma.scRNAseq: skipped (1 member: Macrophages.cells)
#>   DeconRNASeq_CBSX.NSCLC.PBMCs.scRNAseq: skipped (1 member: Monocytes)
#>   Epidish_CBSX.NSCLC.PBMCs.scRNAseq: skipped (1 member: Monocytes)
#>   DeconRNASeq_CCLE.TIL10: Macrophages.M1 + Macrophages.M2 + Monocytes + Dendritic.cells
#>   Epidish_CCLE.TIL10: Macrophages.M1 + Macrophages.M2 + Monocytes + Dendritic.cells
#>   DeconRNASeq_TIL10: Macrophages.M1 + Macrophages.M2 + Monocytes + Dendritic.cells
#>   Epidish_TIL10: Macrophages.M1 + Macrophages.M2 + Monocytes + Dendritic.cells
#>   DWLS_BPRNACan: Macrophages.M0 + Macrophages.M1 + Macrophages.M2 + Monocytes
#>   DWLS_BPRNACan3DProMet: Macrophages.M0 + Macrophages.M1 + Macrophages.M2 + Monocytes
#>   DWLS_BPRNACanProMet: Macrophages.M0 + Macrophages.M1 + Macrophages.M2 + Monocytes
#>   DWLS_CBSX.HNSCC.scRNAseq: Macrophages.cells + Dendritic.cells
#>   DWLS_CBSX.Melanoma.scRNAseq: skipped (1 member: Macrophages.cells)
#>   DWLS_CBSX.NSCLC.PBMCs.scRNAseq: skipped (1 member: Monocytes)
#>   DWLS_CCLE.TIL10: Macrophages.M1 + Macrophages.M2 + Monocytes + Dendritic.cells
#>   DWLS_TIL10: Macrophages.M1 + Macrophages.M2 + Monocytes + Dendritic.cells
#>   CBSX_BPRNACan: Macrophages.M0 + Macrophages.M1 + Macrophages.M2 + Monocytes
#>   CBSX_BPRNACan3DProMet: Macrophages.M0 + Macrophages.M1 + Macrophages.M2 + Monocytes
#>   CBSX_BPRNACanProMet: Macrophages.M0 + Macrophages.M1 + Macrophages.M2 + Monocytes
#>   CBSX_CBSX.HNSCC.scRNAseq: Macrophages.cells + Dendritic.cells
#>   CBSX_CBSX.Melanoma.scRNAseq: skipped (1 member: Macrophages.cells)
#>   CBSX_CBSX.NSCLC.PBMCs.scRNAseq: skipped (1 member: Monocytes)
#>   CBSX_CCLE.TIL10: Macrophages.M1 + Macrophages.M2 + Monocytes + Dendritic.cells
#>   CBSX_TIL10: Macrophages.M1 + Macrophages.M2 + Monocytes + Dendritic.cells
#>   DeconRNASeq_LM22: Macrophages.M0 + Macrophages.M1 + Macrophages.M2 + Monocytes + Dendritic.activated.cells + Dendritic.resting.cells
#>   Epidish_LM22: Macrophages.M0 + Macrophages.M1 + Macrophages.M2 + Monocytes + Dendritic.activated.cells + Dendritic.resting.cells
#>   DWLS_LM22: Macrophages.M0 + Macrophages.M1 + Macrophages.M2 + Monocytes + Dendritic.activated.cells + Dendritic.resting.cells
#>   CBSX_LM22: Macrophages.M0 + Macrophages.M1 + Macrophages.M2 + Monocytes + Dendritic.activated.cells + Dendritic.resting.cells
#>
#> To use the aggregated matrix in other functions:
#>   - replicate_deconvolution_subgroups(): aggregate the same groups in the new cohort first, otherwise their features are set to NA
A group name can be a cell type of the nomenclature
(Myeloid.cells) or a new name (Lymphocytes);
new names must not contain _ nor the name of an existing
cell type.
The returned matrix is a deconvolution matrix as any other, so it can
be given to compute.deconvolution.analysis() if you want
the groups to be analysed too. They are then treated as one more cell
type.
IMPORTANT: group names that are not in the
nomenclature (here Lymphocytes) must be listed in
cells_extra, otherwise these groups are
discarded by
compute.deconvolution.analysis() (and by
compute.benchmark() and
prepare_multideconv_folds()). If in doubt, list all your
group names: the ones already in the nomenclature are simply ignored.
aggregate_cell_groups() prints this reminder after the
summed cell types.
groups = list(Myeloid.cells = myeloid$Myeloid.cells,
              Lymphocytes = c("B.cells", "B.naive.cells", "B.memory.cells", "Plasma",
                              "CD4.cells", "CD4.memory.activated", "CD4.memory.resting", "CD4.naive",
                              "CD4.regulatory", "CD4.non.regulatory", "CD8.cells",
                              "NK.cells", "NK.activated", "NK.resting"))

deconv_groups = aggregate_cell_groups(deconv_bulk, cell_groups = groups, verbose = FALSE)

deconv_subgroups_groups = compute.deconvolution.analysis(deconvolution = deconv_groups,
                                                         corr = 0.7,
                                                         cells_extra = "Lymphocytes")

deconv_subgroups_groups[["Deconvolution subgroups composition"]]$Myeloid.cells
#> $Myeloid.cells_Subgroup.1
#> [1] "CBSX_BPRNACan_Myeloid.cells"
#> [2] "CBSX_BPRNACan3DProMet_Myeloid.cells"
#> [3] "CBSX_BPRNACanProMet_Myeloid.cells"
#> [4] "Epidish_BPRNACan_Myeloid.cells"
#> [5] "Epidish_BPRNACan3DProMet_Myeloid.cells"
#> [6] "Epidish_BPRNACanProMet_Myeloid.cells"
#>
#> $Myeloid.cells_Subgroup.2
#> [1] "CBSX_CBSX.HNSCC.scRNAseq_Myeloid.cells"
#> [2] "DWLS_CBSX.HNSCC.scRNAseq_Myeloid.cells"
#> [3] "Epidish_CBSX.HNSCC.scRNAseq_Myeloid.cells"
#>
#> $Myeloid.cells_Subgroup.3
#> [1] "CBSX_CCLE.TIL10_Myeloid.cells"    "DWLS_CCLE.TIL10_Myeloid.cells"
#> [3] "Epidish_CCLE.TIL10_Myeloid.cells"
#>
#> $Myeloid.cells_Subgroup.4
#> [1] "CBSX_LM22_Myeloid.cells"        "DeconRNASeq_LM22_Myeloid.cells"
#> [3] "DWLS_LM22_Myeloid.cells"        "Epidish_LM22_Myeloid.cells"
#>
#> $Myeloid.cells_Subgroup.5
#> [1] "DeconRNASeq_CCLE.TIL10_Myeloid.cells"
#> [2] "DeconRNASeq_TIL10_Myeloid.cells"
#>
#> $Myeloid.cells_Subgroup.6
#> [1] "DWLS_BPRNACan_Myeloid.cells"         "DWLS_BPRNACan3DProMet_Myeloid.cells"
#> [3] "DWLS_BPRNACanProMet_Myeloid.cells"
#>
#> $Myeloid.cells_Subgroup.7
#> [1] "DWLS_TIL10_Myeloid.cells"    "Epidish_TIL10_Myeloid.cells"
IMPORTANT: if you later replicate these subgroups in
a new cohort with replicate_deconvolution_subgroups() (see
below), run aggregate_cell_groups() with the same
cell_groups on the new deconvolution matrix first.
Otherwise the group features do not exist in the new cohort and are
returned as NA (with a warning).
deconv_new_groups = aggregate_cell_groups(deconv_new, cell_groups = groups)
deconv_new_subgroups = replicate_deconvolution_subgroups(deconv_subgroups_groups, deconv_new_groups)
NOTE: A group can list cell types of different levels of detail, because each signature reports its own. Check the printed lines: within one method-signature combination the summed cell types must not overlap (a cell type together with its own subtypes would be counted twice).
Handling batch effects (multiple cohorts)
When your samples come from multiple cohorts or batches, simple
Pearson/Spearman correlations can be confounded by cohort structure.
compute.deconvolution.analysis() accepts a
batch argument that switches the internal correlation to
partial correlation, controlling for cohort membership
in the correlations used to build the subgroups.
The batch vector must be a factor or character vector
with one label per sample, in the same order as the rows of the
deconvolution matrix.
# Example: 'cohort' has one label per sample ("CohortA" / "CohortB"), in the same order as rownames(deconv_bulk)
cohort <- c(rep("CohortA", 96), rep("CohortB", 96))

deconv_subgroups_batch = compute.deconvolution.analysis(
  deconvolution = deconv_bulk,
  corr          = 0.7,
  batch         = cohort,
  file_name     = "Tutorial_batch",
  return        = TRUE
)
When batch is supplied:
- Correlations between features are partial
correlations that remove the batch effect (via
ppcor::pcor.test(), with one indicator per batch). - Subgroups are built from these partial correlations, so inter-cohort differences do not inflate feature similarity.
This approach is recommended whenever samples originate from distinct studies, sequencing runs, or processing pipelines, as it prevents cohort-specific signals from being mistaken for biologically meaningful co-variation.
Characterizing subgroups with pathway activities
Once subgroups are identified, you can interpret their biological
meaning by correlating each subgroup’s abundance profile across samples
with pathway activity scores. The function
compute.subgroup.pathways() generates one heatmap per cell
type showing how each subgroup correlates with each pathway.
compute.subgroup.pathways() expects a
pre-computed sample × pathway numeric matrix. As an
example, we are going to compute pathway activities using the
PROGENy database (Schubert et al., 2018), making use of
the package CellTFusion.
PROGENy models the activity of 14 cancer-relevant signalling pathways
from gene expression data.
Schubert, M., Klinger, B., Klünemann, M., Sieber, A., Uhlitz, F., Sauer, S., Garnett, M. J., Blüthgen, N., & Saez-Rodriguez, J. (2018). Perturbation-response genes reveal signaling footprints in cancer gene expression. Nature Communications, 9(1), 20. https://doi.org/10.1038/s41467-017-02391-6
# Install CellTFusion if needed (once):
# pak::pkg_install("VeraPancaldiLab/CellTFusion")
library(CellTFusion)

counts     <- multideconv::raw_counts
counts_tpm <- ADImpute::NormalizeTPM(counts, log = FALSE)

# compute.pathway.activity() returns a sample x pathway activity matrix
pathway_scores <- compute.pathway.activity(counts_tpm)

compute.subgroup.pathways(
  subgroups = deconv_subgroups,
  pathways  = pathway_scores,
  file_name = "Tutorial",
  pval      = 0.05
)
Any other sample × pathway matrix (e.g. from GSVA, ssGSEA, or
decoupleR) can be passed as pathways in the same way.
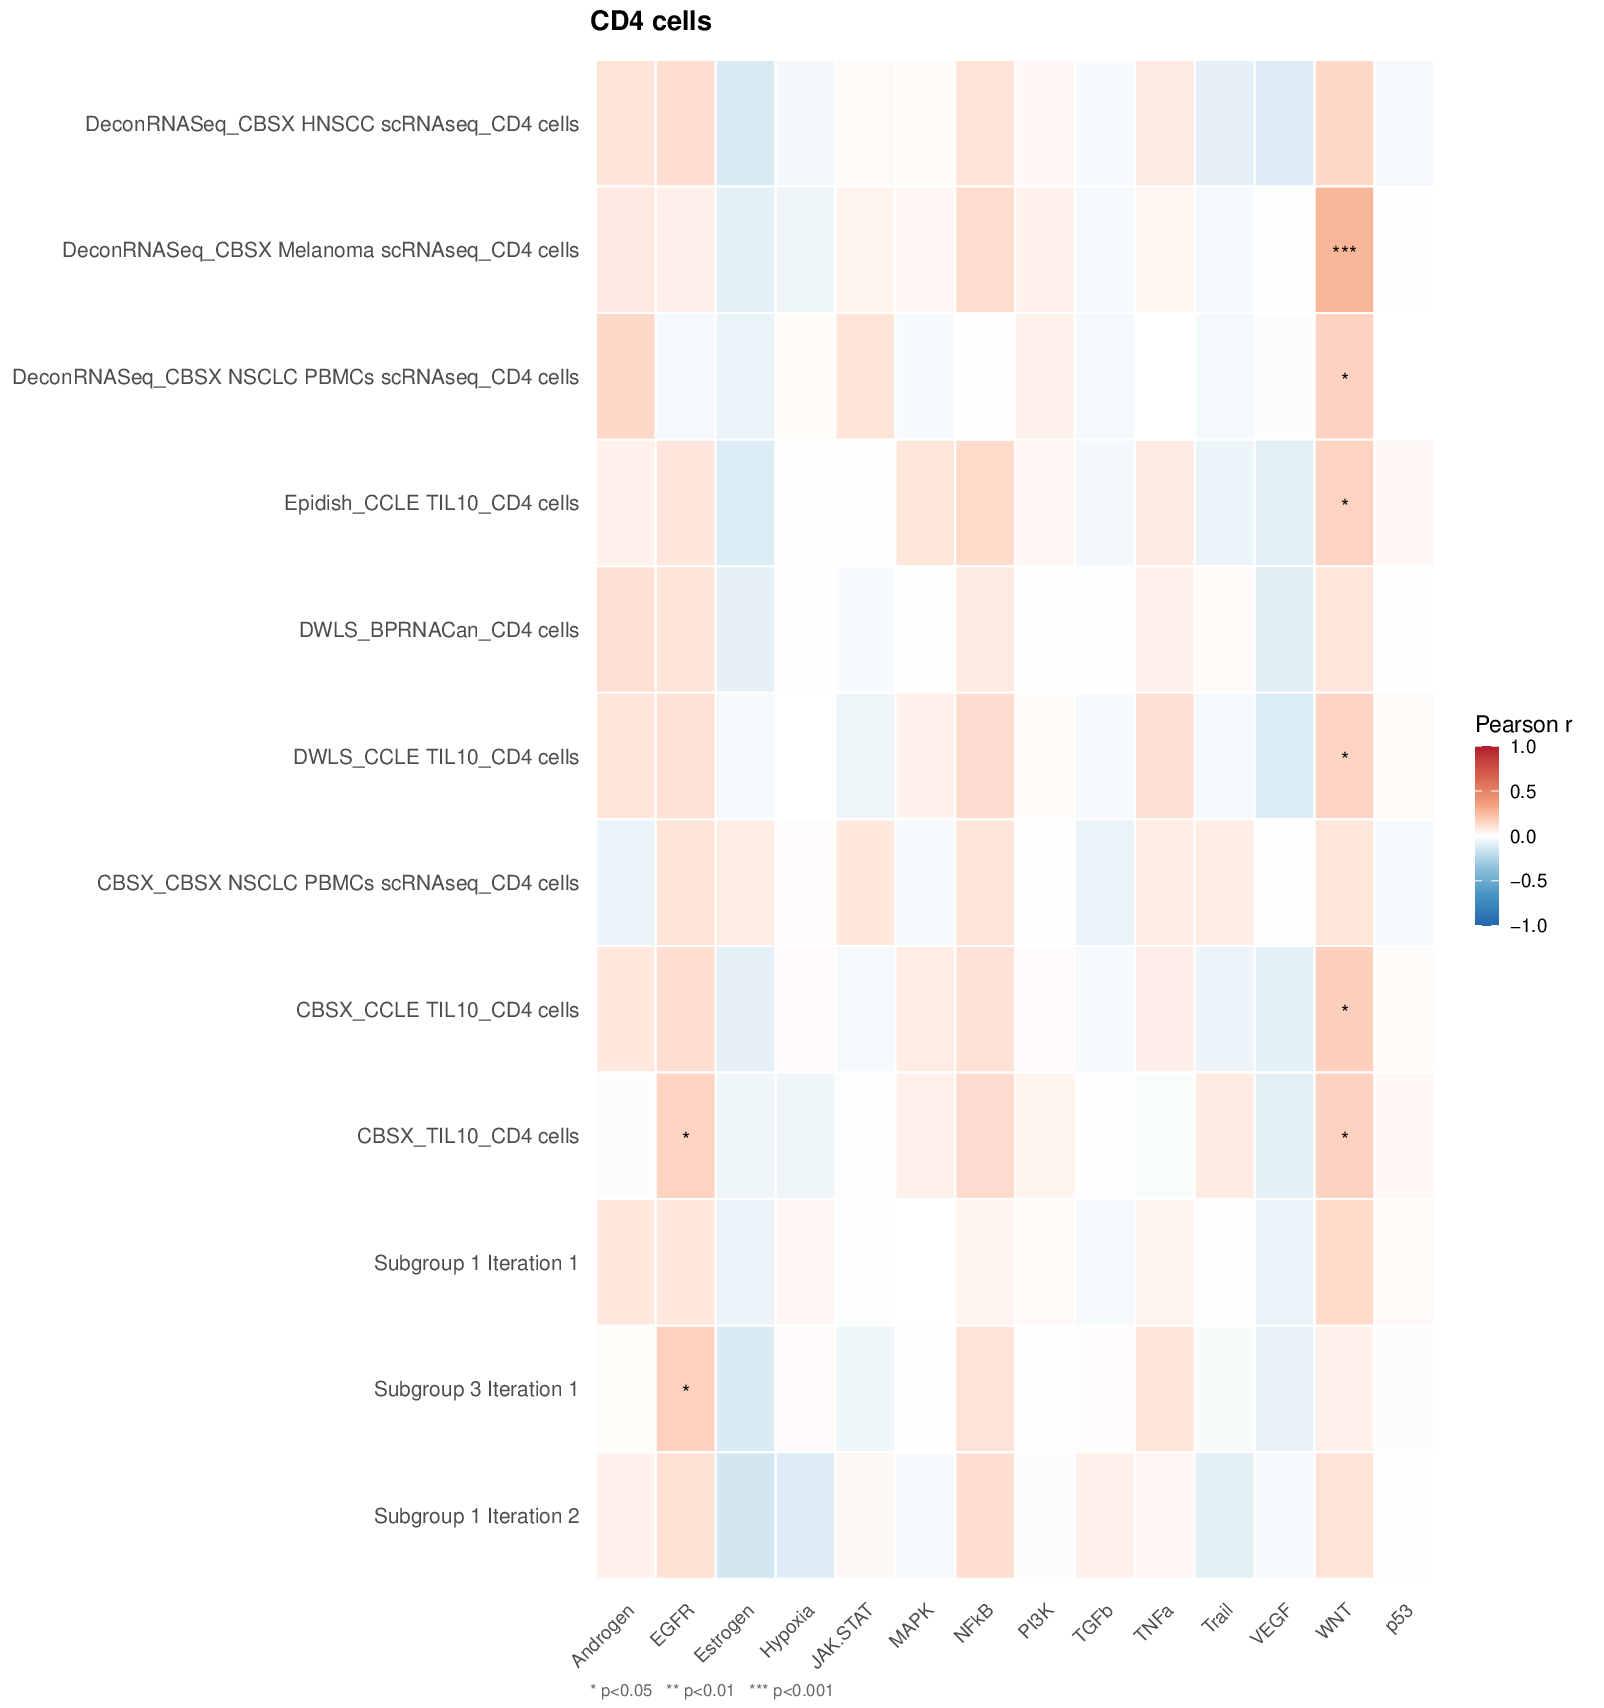
One PDF heatmap per cell type is saved to Results/. The
function also returns (invisibly) a list with the correlations and
p-values of each cell type, and corr_type selects Pearson
(default) or Spearman correlations. Below is an example output for CD4 T
cells (12 subgroups × 14 PROGENy pathways), where stars indicate
significance levels (* p<0.05, ** p<0.01, *** p<0.001):
Replicate deconvolution subgroups in an independent set
Cell subgroup identification through deconvolution is cohort-specific, as it relies on correlation patterns across samples. This means that subgroup definitions may vary across different splits or datasets. If you aim to replicate the same subgroups identified in one dataset onto another (e.g., for model validation), you can use the following function.
The function below reconstructs and applies the subgroup signatures derived from a previous deconvolution, making it especially useful when transferring learned patterns across datasets — such as when training and evaluating machine learning models.
deconv_1 = deconv_bulk[1:100,]
deconv_2 = deconv_bulk[101:192,]

deconv_subgroups = compute.deconvolution.analysis(deconvolution = deconv_1,
                                                  corr = 0.7,
                                                  file_name = "Tutorial",
                                                  return = FALSE)
deconv_subgroups_replicate = replicate_deconvolution_subgroups(deconv_subgroups,
                                                               deconv_2)